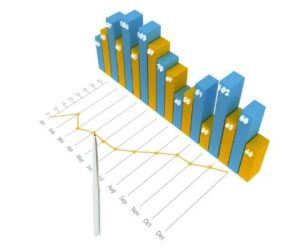
Infographic – There are times when just words are insufficient, and an image is far more effective.
That is the underlying concept behind an infographic, which is one of the most adaptable content kinds and a powerful tool for your company to attain relevance and visibility.
You’ve undoubtedly seen dozens of infographics on the internet. They often present information in an easy-to-understand style, incorporate photos and charts, and are occasionally animated. Infographics come in a variety of shapes and sizes, which adds to their value as a content format.
Now is the time to learn how to use infographics to strengthen your brand. To get the most out of it, you need to know how to utilize it properly. You risk having the opposite effect and pushing your audience away from your company if you don’t.
Have you ever considered making an infographic for your business? Learn what this type of material is, how to create it, and the best design practises you should be aware of in this post.
What is the definition of an infographic?

An infographic is a content type that combines text and visual elements to quickly and easily deliver information to the viewer. This blend is cohesive because each of the components is used to address the main piece of information in the most effective way possible.
After all, there are occasions when writing alone is insufficient to completely describe a topic or piece of data. Certain data can be made easier to grasp with the use of visual components, which could be crucial for the brand’s capacity to generate engagement and relevancy.
When looking at a geographical infographic that outlines the places of the world that have previously reported instances and those that have not, for example, it is much easier to appreciate the impact of a pandemic.
You could certainly give the same information via text, but it would be less intuitive.
5 Tips for Great Digital Marketing
The advantages of making an infographic for your company
Tool for effective branding
The more you experiment with various types of content, the more powerful your brand becomes. Always explore for opportunities to link your company’s identity to relevant, entertaining content.
Infographics may assist you with this while keeping your audience delighted because they are extremely shareable.
Simpler to comprehend
Your brand will quickly lose relevance among its target audience if it does not communicate in an intuitive manner.
To distribute each piece of information, you should always use the best type of material available, which includes incorporating the benefits of infographics into your content marketing approach.
Potential for viral spread
When your work goes viral, it reaches a far larger audience than it would otherwise. Your brand may gain more notoriety, which can have a favourable impact on your outcomes.
Infographics are enticing to share on social media and blogs, and they have the potential to become viral, bringing your brand’s name with them.
Relevance in SEO
Because infographics can help spread the word about your business, this also pertains to the SEO value of your material. This piece of content can assist in pushing your blog articles and website pages to the top of Google’s search results.
This is a fantastic approach to increase your visibility and attract visitors that are interested in what you have to offer.
Top 20 web crawler tools to scrape the websites
What are the main types of infographics?
Now that you have a basic understanding of what an infographic is and the benefits of using it, the next step is to learn about the many types of infographics.
This will assist you in deciding which method to adopt when making your own infographics for your company. Multiple variants entirely modify the display because it is such a flexible content structure.
Here are some examples of common sorts of infographics to get you started:
When most people think of an infographic, they probably think of one that provides information.
It’s most commonly utilised to present a wide overview of a subject in a straightforward manner. The informative infographic is given as a short text with a lot of images to make it more appealing and easy to read.
An informational infographic’s most distinguishing feature is its conciseness. It is intended to deliver information in a few words and graphics, allowing the viewer to immediately grasp the topic at hand.
Infographic with statistics
The statistical infographic, as the name implies, is largely concerned with numbers, charts, and indicators. It frequently uses large numbers to draw the viewer’s attention, as well as graphs in a variety of forms and colours.
The statistical infographic is frequently used to display survey results, market research findings, and raw data to back up assertions. The fundamental aim is to build a tale with a logical beginning and end using the statistical data shown in the infographic.
Infographic on comparisons
Comparing two pieces of information is sometimes the greatest approach to convey knowledge. The comparison infographic puts a contrast in the spotlight, allowing viewers to develop their own conclusions and make decisions based on the information provided.
In most cases, this material type does not express its own viewpoint.
The style of the infographic often aids this contrast, for as by allowing for easier comparison by displaying equivalent components side by side. In a split-in-half infographic, two sides are usually presented.
Infographic on geography
When the main piece of content refers to one or more locations, you should develop a geographic infographic. When there is data to be displayed in relation to maps, it is generally used.
This is a fantastic way to compare and contrast places, as well as emphasise crucial information about them and others.
There are several methods for assisting your reader in comprehending your facts in the context of location. Heat maps, pins on specific regions with pertinent information, and even comparisons between such areas can all be used.
Infographic with a list

An infographic with lists divides a collection of data into unordered or ordered lists. This should be your choice if you want to create a top ten list, a step-by-step method, or just use a list to deliver information in smaller pieces.
You can use your imagination to replace the bullet points with other features to make your work stand out, as well as to organise the themes in the given space in an easy-to-read manner.
It can be digested rapidly because most individuals will browse through the list of topics and read through whatever piques their attention.
